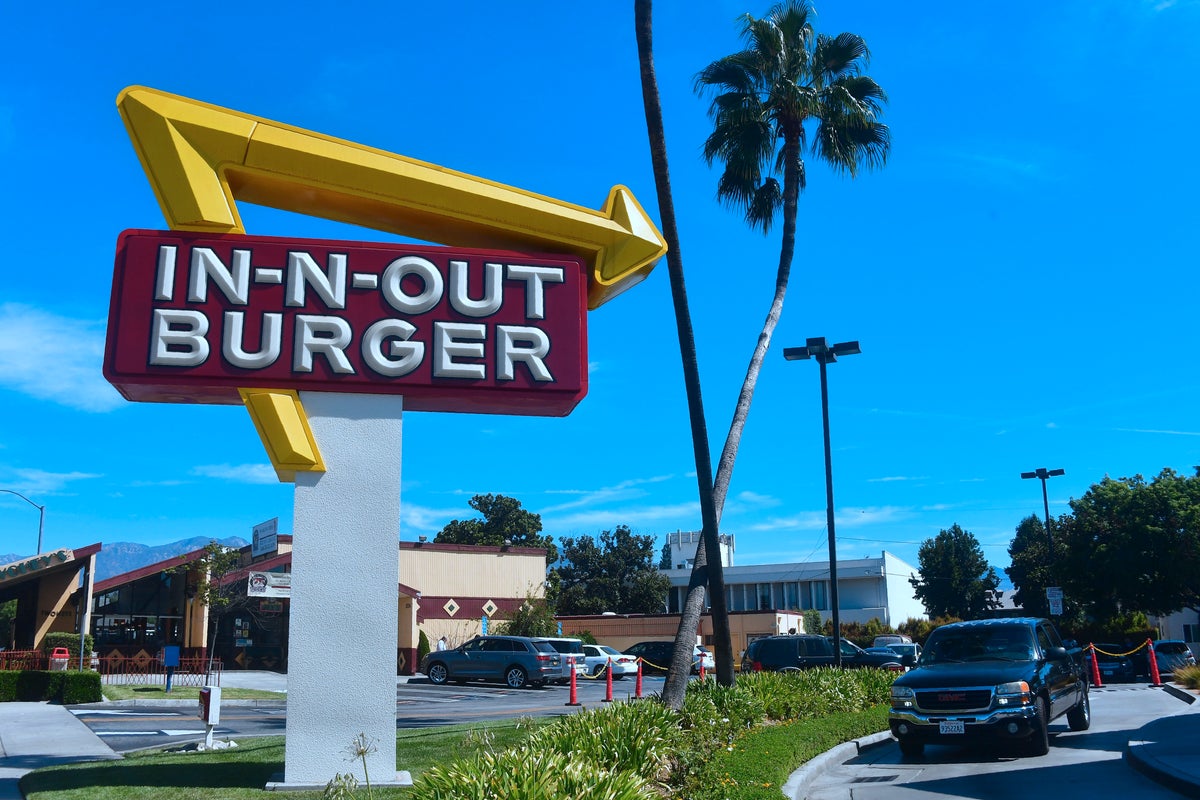
The escalating regulatory battle in Culver City, California, over a proposed In-N-Out Burger development represents far more than a localized dispute over fast-food access. It is a structural collision between auto-centric commercial real estate design and the modern principles of transit-oriented development (TOD). When the Culver City Council voted to extend its temporary moratorium on new drive-thru permits for an additional 10 months and 15 days, it codified a growing municipal thesis: the traditional drive-thru is a land-use anomaly that transfers private operational externalities onto public infrastructure.
To evaluate this regulatory shift, we must move past emotional arguments regarding suburban convenience versus neighborhood character. Instead, we must quantify the friction. By examining drive-thru mechanics through the lenses of queuing theory, municipal economics, and commercial real estate optimization, we can map the true systemic costs of auto-centric retail designs in high-density corridors. You might also find this related article useful: Stop Trying to Open the Strait of Hormuz (Let It Burn).
The Physics of the Queue: Analyzing Traffic Spillover
The core operational metric of any drive-thru is throughput. However, when private capacity fails to absorb peak demand, the excess queue spills onto public arterials, creating a localized bottleneck.
The proposed Culver City In-N-Out on Sepulveda Boulevard features a design engineered to hold 26 vehicles in its queuing lanes alongside 61 standard parking spaces. On paper, a 26-car stack appears generous. In practice, high-volume quick-service restaurants (QSRs) regularly breach this threshold during peak hours (11:30 AM to 1:30 PM and 5:00 PM to 7:00 PM). As extensively documented in latest reports by Bloomberg, the implications are notable.
To model this risk, we utilize a standard queueing model where arrival rate ($\lambda$) and service rate ($\mu$) dictate system behavior. In a standard $M/M/1$ queuing system, where arrivals follow a Poisson process and service times are exponentially distributed, the probability $P_n$ of having exactly $n$ vehicles in the system is expressed as:
$$P_n = (1 - \rho)\rho^n$$
Where the traffic intensity (utilization rate) $\rho$ is defined by:
$$\rho = \frac{\lambda}{\mu}$$
For high-volume locations where demand frequently matches or exceeds operational capacity ($\rho \ge 1$), the queue length grows indefinitely unless constrained by physical space or customer abandonment. Under peak conditions where $\rho = 0.95$ (meaning arrival rate is at 95% of maximum service capacity), the probability of the queue length exceeding the physical design capacity of $C = 26$ vehicles is calculated by:
$$P(N > C) = \rho^{C+1}$$
$$P(N > 26) = (0.95)^{27} \approx 0.25$$
This indicates a 25% probability that the queue will exceed physical on-site capacity during peak operating hours. When this threshold is crossed, the queue spills onto public streets. In a dense suburban corridor like Sepulveda Boulevard, this spillover causes immediate arterial degradation:
- Blockage of Right-Of-Way: Spilling vehicles obstruct the right-hand travel lane, reducing a multi-lane arterial's carrying capacity by up to 50%.
- Conflict Point Multiplication: Left-turning movements across oncoming traffic into a stalled queue increase vehicle-to-vehicle conflict points, accelerating collision rates.
- Pedestrian Conflict Zones: Drive-thru entry and exit points cross sidewalk infrastructure. At 250 vehicles per hour, a single drive-thru throat creates 500 pedestrian conflict events per hour, significantly elevating risk profiles near schools or parks.
The Environmental Cost Function of Idling
Opponents of drive-thrus frequently cite localized air pollution, particularly near sensitive locations like Culver City’s El Rincon Elementary School. To ground this in data, we must look at the environmental cost function of idling versus start-stop cycles.
Modern internal combustion engine (ICE) vehicles consume approximately 0.2 to 0.5 gallons of fuel per hour while idling. More importantly, idling engines operate inefficiently, producing higher concentrations of incomplete combustion byproducts per unit of fuel burned compared to vehicles moving at cruising speeds.
The total daily localized emissions mass $E_m$ generated by a single drive-thru facility can be modeled as:
$$E_m = \sum_{i} \left( N \cdot T_{avg} \cdot EF_i \right)$$
- $N$: Total daily drive-thru vehicle volume.
- $T_{avg}$: Average time spent idling in the queue (expressed in hours).
- $EF_i$: Emission factor for pollutant $i$ (e.g., $CO$, $NO_x$, $PM_{2.5}$) in grams per vehicle-hour of idling.
At a high-volume location processing 1,200 drive-thru transactions daily, with an average queue duration ($T_{avg}$) of 6 minutes (0.1 hours), the site generates 120 vehicle-hours of active idling per day. Using typical fleet-average emission factors for light-duty vehicles idling at operating temperature:
| Pollutant | Emission Factor ($g/hr$) | Daily Localized Mass ($g$) | Annual Localized Mass ($kg$) |
|---|---|---|---|
| Carbon Monoxide ($CO$) | 84.0 | 10,080 | 3,679.2 |
| Nitrogen Oxides ($NO_x$) | 0.9 | 108 | 39.4 |
| Particulate Matter ($PM_{2.5}$) | 0.08 | 9.6 | 3.5 |
This localized concentration of pollutants occurs entirely at ground level, directly adjacent to sidewalks and pedestrian pathways. Because pollutants do not disperse instantly, they create a micro-climate of degraded air quality within a 150-meter radius of the drive-thru throat, exposing pedestrians, cyclists, and nearby residents to elevated particulate levels.
The Land-Value Deficit: Opportunity Cost of Asphalt
From a municipal finance perspective, drive-thrus present a highly inefficient use of valuable urban land. High-density, walkable transit-oriented developments yield significantly higher municipal tax revenue per square foot than auto-centric commercial structures.
Consider the spatial allocation of the proposed development. A typical modern drive-thru site requires a massive physical footprint relative to its interior retail area:
[Building Core: 3,000 sq ft] ---> [Queuing Lanes: 8,000 sq ft] ---> [Surface Parking: 20,000 sq ft]
Out of a total site area of approximately 31,000 square feet, less than 10% is dedicated to productive indoor commercial space. The remaining 90% is allocated to low-yield asphalt infrastructure designed exclusively to store and move private vehicles.
This spatial allocation creates a distinct land-value deficit. We can quantify this by comparing the municipal yields of a drive-thru model against a mixed-use transit-oriented development (TOD) model on an identical 0.7-acre (approx. 30,000 sq ft) parcel in a prime Southern California corridor:
The Drive-Thru Model (Single-Story QSR)
- Capital Investment: High equipment cost, low structural value.
- Assessed Property Value: Relatively low, as valuation heavily weights structural improvements over unimproved land.
- Sales Tax Yield: High per square foot of building space, but restricted to the small building footprint.
- Employment Density: Approximately 15 to 25 jobs per shift.
- Municipal Cost: High infrastructure wear on adjacent roads due to heavy vehicle counts.
The Mixed-Use TOD Model (4-Story Residential over Retail)
- Capital Investment: High structural value (30-40 residential units over 5,000 sq ft of ground-floor retail).
- Assessed Property Value: Significantly higher, resulting in an estimated 4x to 6x increase in annual property tax yield for the municipality.
- Sales Tax Yield: Moderately lower per square foot than a top-tier QSR, but distributed across multiple stable retail bays.
- Housing Contribution: Directly addresses regional housing shortages, aligning with state-mandated Regional Housing Needs Allocation (RHNA) targets.
- Active Transportation Integration: Lowers municipal road maintenance costs by shifting short-trips to walking, biking, or public transit.
By permitting drive-thrus on scarce commercial parcels, suburban municipalities essentially subsidize auto-centric retail business models at the expense of long-term property tax growth and housing development.
The Quick-Service Restaurant Pivot: Operational Adaptation
For QSR operators, a drive-thru ban is not a death sentence; rather, it is a catalyst for physical and digital restructuring. Historically, the drive-thru has generated up to 70% of fast-food sales nationwide. Restricting this channel forces brands to capture demand through alternative fulfillment mechanisms.
       [Traditional Drive-Thru Model]
                     |
         (Drive-Thru Ban Implemented)
                     |
                     v
       [Multi-Channel Fulfillment Pivot]
       /             |             \
      /              |              \
 [Walk-Up Window] [Mobile App]  [Dedicated Curbside]
 (Pedestrians/    (Geofenced     (Short-term parking
  Cyclists)       Prep-Trigger)   for fast turnover)
To maintain high throughput volumes without a physical lane, operators must transition to a multi-channel fulfillment framework:
- Dual Walk-Up Windows: Mimicking the classic mid-century walk-up format, dual exterior windows separate pedestrian traffic from digital third-party delivery drivers. This minimizes indoor congestion and keeps walk-up transaction times under 90 seconds.
- Geofenced Mobile App Integration: Utilizing precision GPS geofencing, the restaurant’s kitchen receives an automated signal to drop fries and grill patties only when the mobile customer crosses a 500-meter radius threshold. This ensures the order is ready exactly as the customer arrives on foot or by bike, reducing dwell times to near-zero.
- Dedicated Curbside and Micro-Stalls: Rather than allowing cars to idle in a continuous loop, operators can utilize a small footprint of dedicated, short-term parking stalls (maximum 3-minute limit) for rapid-hand-off mobile orders. This setup converts continuous idling into a brief engine-off park cycle, lowering localized emissions.
These operational adjustments demonstrate that the quick-service model can thrive in dense, pedestrian-oriented nodes. Banning the drive-thru lane does not ban the restaurant; it simply demands a more space-efficient, urban-compatible design.
Strategic Playbook: The Path Forward for Municipalities
Municipalities seeking to replicate the Culver City or Carlsbad models must avoid blunt-force bans that invite immediate legal challenges or stunt local economic growth. Instead, they should deploy a structured regulatory framework that disincentivizes auto-centric layouts while incentivizing high-density, active-transportation commercial models.
Municipalities should establish clear zoning overlays that transition from total prohibitions in pedestrian zones to performance-based design standards in suburban corridors. Implementing strict maximum allowable queue lengths—where any spillover onto public streets triggers automatic civil penalties—forces operators to internalize their traffic impacts.
Ultimately, the drive-thru ban is not an anti-business measure. It is a necessary correction of a market externality, reclaiming public space from idling vehicles and redirecting prime urban real estate toward its highest and best use.
For a detailed look at how local municipal decisions are impacting development and community dynamics in the region, see this report on the Culver City City Council vote to extend the ban on drive-thrus. This broadcast highlights the immediate neighborhood reactions and the council's next steps during the moratorium.